Essential Performance Metrics and KPI Dashboards for Modern Finance Teams
Essential performance metrics and KPI dashboards for modern finance teams
In today’s fast-paced business world, finance teams play a crucial role in driving growth and managing risks. To maintain competitive advantage, these teams rely heavily on performance metrics and KPI dashboards that provide clear, actionable insights. With the increasing volume of data and complexity of financial operations, understanding which metrics to track and how to visualize them effectively is more important than ever. This article explores the essential performance metrics every modern finance team should monitor and discusses how KPI dashboards can transform raw data into strategic decision-making tools, helping finance professionals align with broader business objectives and demonstrate tangible value.
Key financial performance metrics every team should track
At the core of any finance team’s work are financial performance metrics that reflect the health and trajectory of the organization. These typically include:
- Revenue growth rate: Indicates expansion or contraction over a period, essential for predicting future performance.
- Gross profit margin: Shows the proportion of revenue remaining after direct costs, revealing operational efficiency.
- Operating cash flow: Demonstrates actual cash generated from core activities, critical for understanding liquidity.
- Days sales outstanding (DSO): Measures the average collection period for receivables, which affects cash flow management.
- Return on equity (ROE): Assesses profitability relative to shareholder equity, a key indicator for investors.
Tracking these KPIs regularly allows finance teams to detect issues early, optimize performance, and support strategic planning.
The role of KPI dashboards in modern finance management
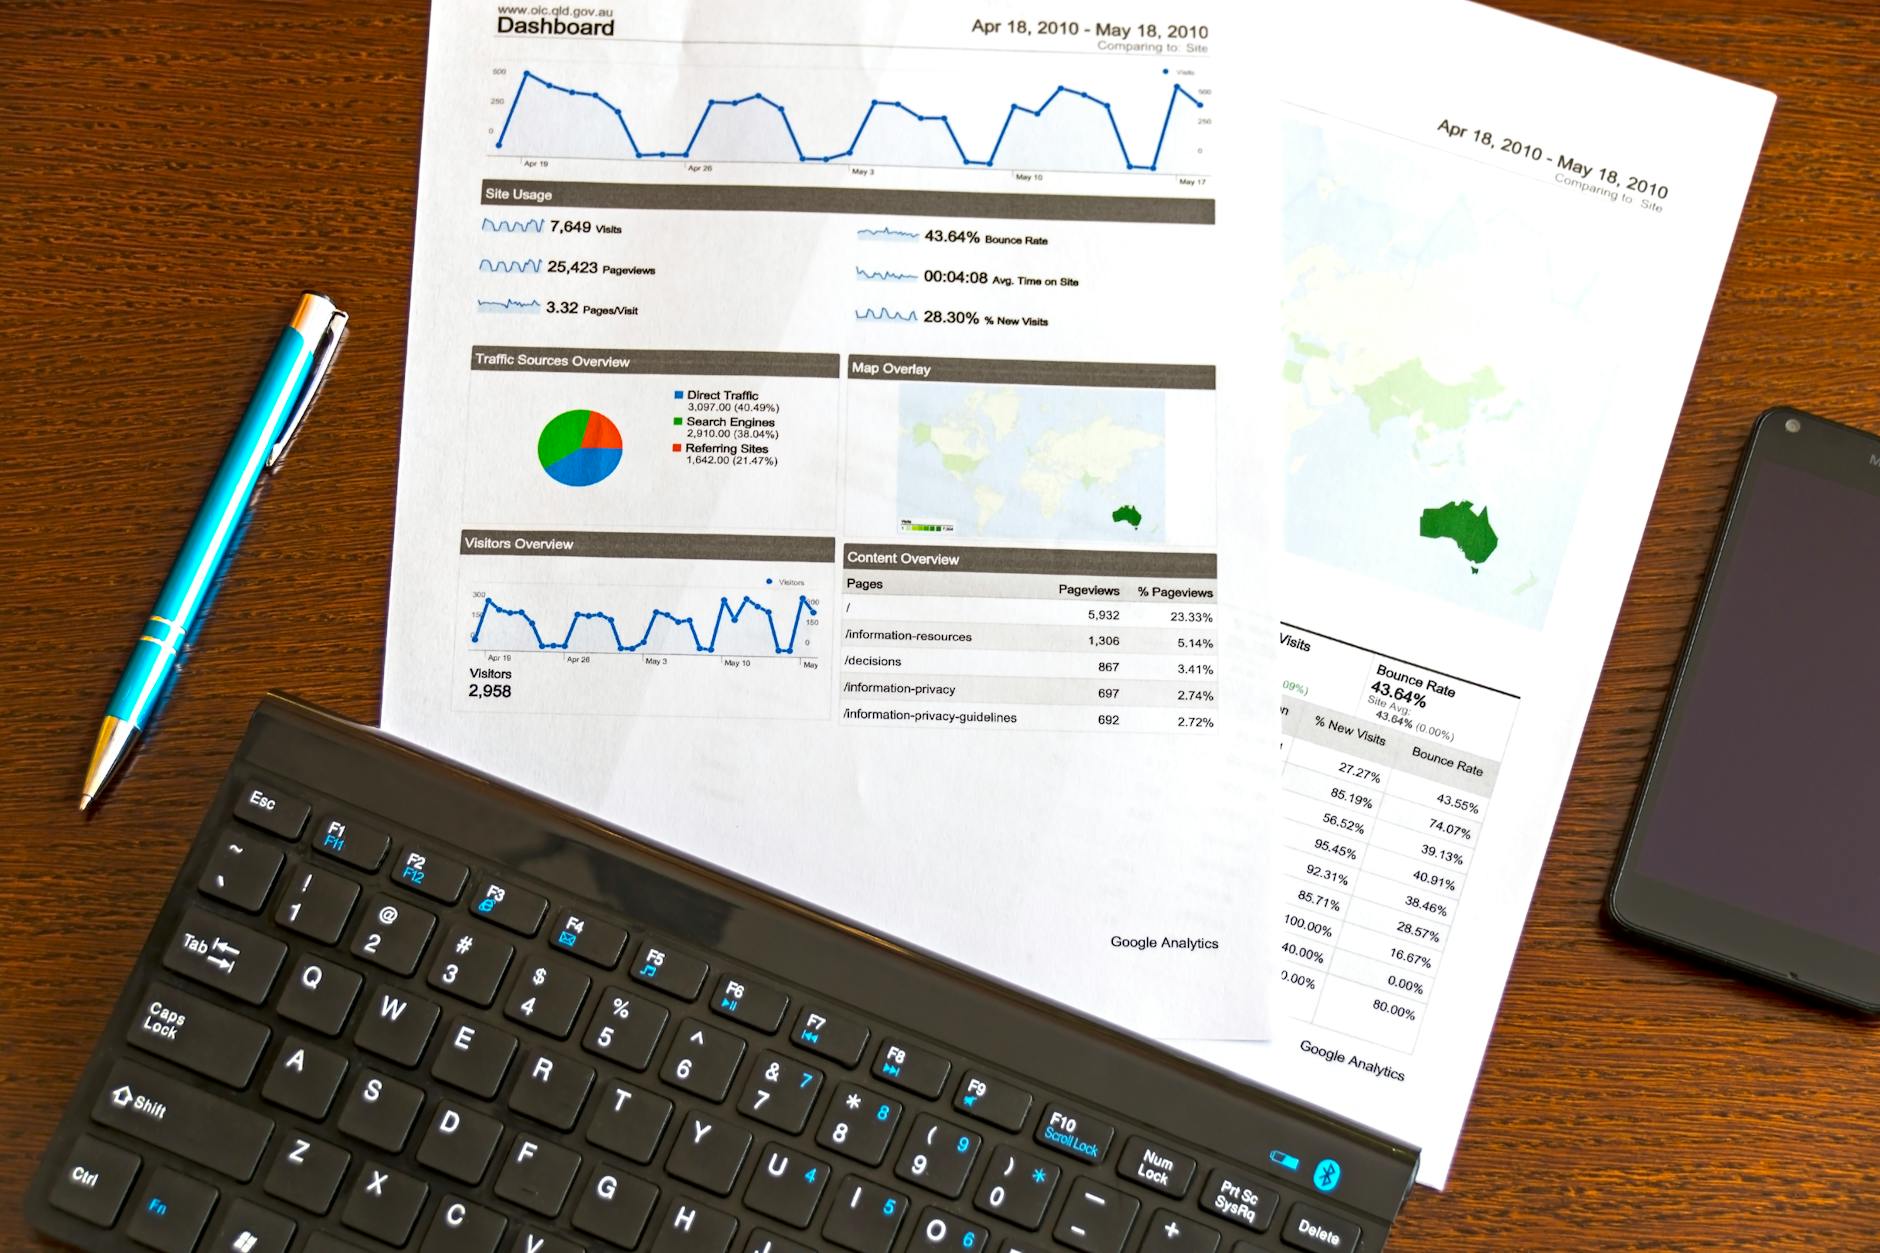
KPI dashboards transform raw financial data into visual formats such as charts and graphs, making complex information easy to interpret at a glance. For finance teams, dashboards provide several benefits:
- Real-time monitoring: Enables quick response to any abnormalities or trends as they occur.
- Data consolidation: Integrates data from multiple sources to present a unified view of financial health.
- Customizability: Allows finance managers to focus on specific metrics valuable to their operation or strategy.
- Enhanced collaboration: Facilitates cross-functional communication by presenting shared performance indicators.
By leveraging automated KPI dashboards, finance teams can shift from reactive number crunching to proactive business insights.
Aligning finance KPIs with business objectives
Simply measuring finance-specific metrics is not enough; it is vital to ensure these KPIs support broader organizational goals. For instance, if a company aims to improve profitability by 10%, finance KPIs should include margin improvement, cost reduction, and efficient capital allocation. Alignment can be achieved by:
- Regularly reviewing KPIs in strategic meetings to check relevance.
- Adjusting dashboards to reflect evolving business priorities.
- Involving key stakeholders to validate which metrics matter most.
This ensures finance teams contribute directly to value creation and avoid siloed reporting.
Best practices for implementing effective KPI dashboards
Creating KPIs and dashboards that truly benefit finance teams requires thoughtful execution. Some best practices include:
- Focus on actionable metrics: Avoid cluttering dashboards with vanity metrics that don’t drive decisions.
- Use clear visualizations: Employ charts and color coding to highlight trends and exceptions quickly.
- Ensure data accuracy: Implement rigorous data validation to maintain trust in reported metrics.
- Enable drill-down capabilities: Allow users to explore underlying data for better context.
- Provide training and support: Help finance professionals maximize dashboard usage.
By following these guidelines, organizations can enhance transparency, accountability, and strategic agility.
Summary of essential finance KPIs and dashboards
| Financial metric | Description | Strategic relevance |
|---|---|---|
| Revenue growth rate | Percentage increase or decrease in sales over time | Indicates business expansion potential |
| Gross profit margin | Revenue remaining after direct costs | Reflects operational efficiency |
| Operating cash flow | Cash generated by core operations | Measures liquidity and financial health |
| Days sales outstanding | Average time to collect receivables | Impacts cash flow management |
| Return on equity (ROE) | Profitability relative to shareholder investment | Key for investor confidence |
In conclusion, essential performance metrics combined with well-designed KPI dashboards empower modern finance teams to provide critical insights, improve decision making, and align financial management with overarching business objectives. Selecting the right KPIs requires an understanding of both finance fundamentals and organizational strategy, while dashboard tools help visualize this data effectively and in real time. When implemented thoughtfully, these components enable finance professionals to shift from historical analysis toward proactive, strategic partners in business growth. The future of finance lies in leveraging data-driven metrics and intelligently designed dashboards that facilitate agility, transparency, and collaboration across all levels of the organization.
Image by: AS Photography
https://www.pexels.com/@asphotography
news via inbox
Nulla turp dis cursus. Integer liberos euismod pretium faucibua


