
Essential Performance Metrics and KPI Dashboards for Modern Finance Teams
Essential performance metrics and KPI dashboards for modern finance teams are transforming how organizations monitor financial health and make data-driven decisions. In today’s dynamic business environment, finance teams must move beyond traditional reporting and adopt real-time, actionable insights to stay competitive. With growing complexity in regulations, market trends, and internal processes, understanding which metrics truly matter is critical. Equally important is the visualization of these metrics through intuitive KPI dashboards. These tools not only provide clarity on current performance but also forecast future challenges and opportunities. In this article, we explore the key performance indicators (KPIs) that modern finance professionals should focus on and how customized dashboards empower better financial strategy and operational efficiency.
Identifying essential KPIs for financial health
To drive meaningful decisions, finance teams must prioritize KPIs that reflect the organization’s core financial stability and growth potential. These metrics range from profitability indicators like gross margin and net profit margin to liquidity measurements like current ratio and quick ratio. Additionally, cash flow metrics—such as operating cash flow and free cash flow—offer crucial insights into the company’s ability to meet obligations and invest in new initiatives.
Another dimension includes efficiency KPIs like days sales outstanding (DSO) and days payable outstanding (DPO), essential for managing working capital. By tracking these together, finance teams gain a comprehensive view of both profitability and operational efficiency.
Integrating KPI dashboards for real-time monitoring
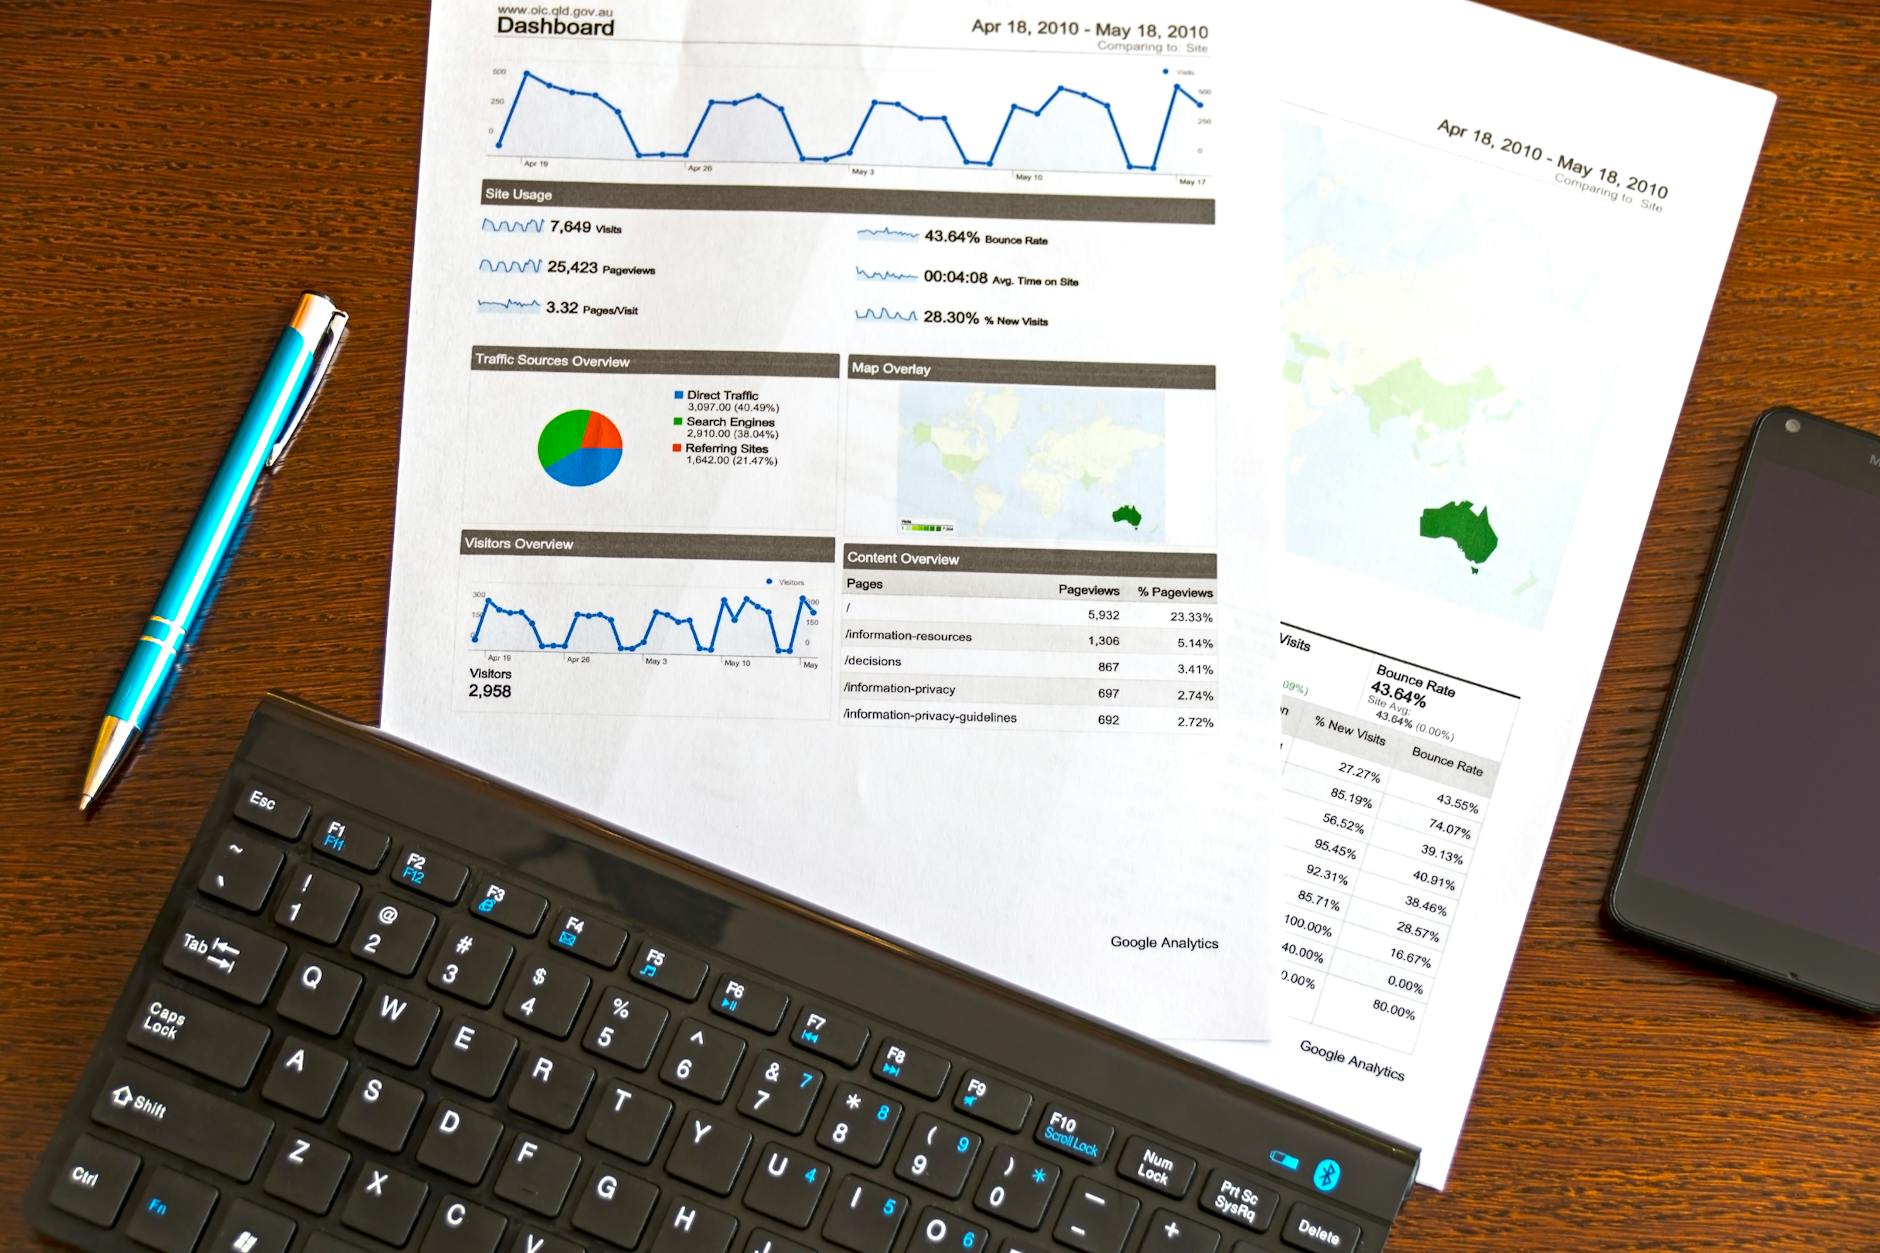
The power of KPIs is greatly amplified when integrated into dynamic dashboards. Modern finance teams leverage business intelligence (BI) platforms such as Power BI, Tableau, or proprietary software that allow for real-time data streaming and interactive visualizations. These dashboards consolidate data from multiple sources, providing an at-a-glance view of financial performance.
For example, a dashboard might display revenue trends, expense breakdowns, and cash flow status simultaneously, enabling faster identification of issues like cost overruns or declining sales. Interactive drill-down features also allow users to investigate anomalies and conduct deeper analysis.
Aligning financial KPIs with strategic goals
KPIs should never exist in isolation; they must align with the company’s broader strategic objectives. For modern finance teams, this means selecting metrics that support growth targets, risk management, and operational excellence. For instance, a company focused on rapid expansion may prioritize sales growth rate and capital expenditure efficiency, while a risk-averse firm might emphasize debt-to-equity ratio and cash reserves.
Regularly revisiting KPIs ensures they remain relevant as business priorities evolve. This alignment fosters collaboration between finance and other departments, encouraging data-driven discussions that propel the organization forward.
Using KPI dashboards to improve forecasting and decision-making
Beyond tracking past and current performance, KPI dashboards are invaluable tools for forecasting and scenario planning. Finance teams can model various assumptions—like changes in sales volume, cost structures, or market conditions—and see their impact on projected cash flow, profit margins, or debt levels.
Combining historical data with predictive analytics embedded in dashboards enhances accuracy and confidence in financial projections. This forward-looking insight supports budgeting, capital allocation, and risk mitigation, allowing management to make informed decisions quickly and effectively.
| KPI | Definition | Purpose |
|---|---|---|
| Gross margin | Revenue minus cost of goods sold (COGS) divided by revenue | Measures profitability before operating expenses |
| Operating cash flow | Cash generated from core business activities | Assesses ability to sustain operations |
| Current ratio | Current assets divided by current liabilities | Indicates short-term liquidity |
| Days sales outstanding (DSO) | Average number of days to collect payment from customers | Evaluates efficiency of receivables management |
| Debt-to-equity ratio | Total liabilities divided by shareholder equity | Measures financial leverage and risk |
In conclusion, essential performance metrics and KPI dashboards are indispensable tools for modern finance teams seeking to navigate complex financial landscapes. By selecting KPIs that holistically measure profitability, liquidity, and operational efficiency, finance professionals build a robust foundation for monitoring organizational health. The integration of intuitive, real-time dashboards allows these teams to visualize data clearly and act swiftly. Further, aligning KPIs with strategic goals enhances collaboration and ensures efforts remain focused on what truly drives business success. Finally, the use of these dashboards for forecasting empowers finance leaders to anticipate challenges and seize opportunities confidently. Embracing these practices ultimately leads to smarter, faster, and more effective financial management in any organization.
Image by: AS Photography
https://www.pexels.com/@asphotograpy
news via inbox
Nulla turp dis cursus. Integer liberos euismod pretium faucibua


