Essential Performance Metrics and KPI Dashboards for Modern Finance Teams
Essential performance metrics and KPI dashboards for modern finance teams play a critical role in driving informed decision-making and maintaining financial health within organizations. In today’s rapidly evolving business environment, finance teams must not only track standard accounting figures but also leverage dynamic key performance indicators (KPIs) to gain deeper insights into operational efficiency, profitability, and strategic alignment. This article explores the most important performance metrics that modern finance teams should monitor and explains how KPI dashboards can transform raw data into actionable intelligence. Through an integrated approach, finance professionals can enhance forecasting accuracy, risk management, and regulatory compliance, ultimately contributing to sustainable business growth.
Understanding key performance metrics
Performance metrics are quantifiable measures that reflect the financial and operational status of a company. For finance teams, these metrics extend beyond basic accounting to encompass areas such as cash flow management, revenue trends, cost control, and efficiency ratios. Some essential metrics include:
- Gross Profit Margin: Indicates the percentage of revenue exceeding cost of goods sold, highlighting profitability.
- Operating Expense Ratio: Measures operating expenses as a percentage of total revenue, showcasing cost efficiency.
- Days Sales Outstanding (DSO): Evaluates the average collection period for receivables, important for cash flow health.
- Return on Equity (ROE): Demonstrates the return generated on shareholders’ equity, reflecting profit generation efficiency.
Tracking these core metrics enables finance teams to monitor financial performance comprehensively and detect areas requiring attention before issues escalate.
The role of KPI dashboards in financial management
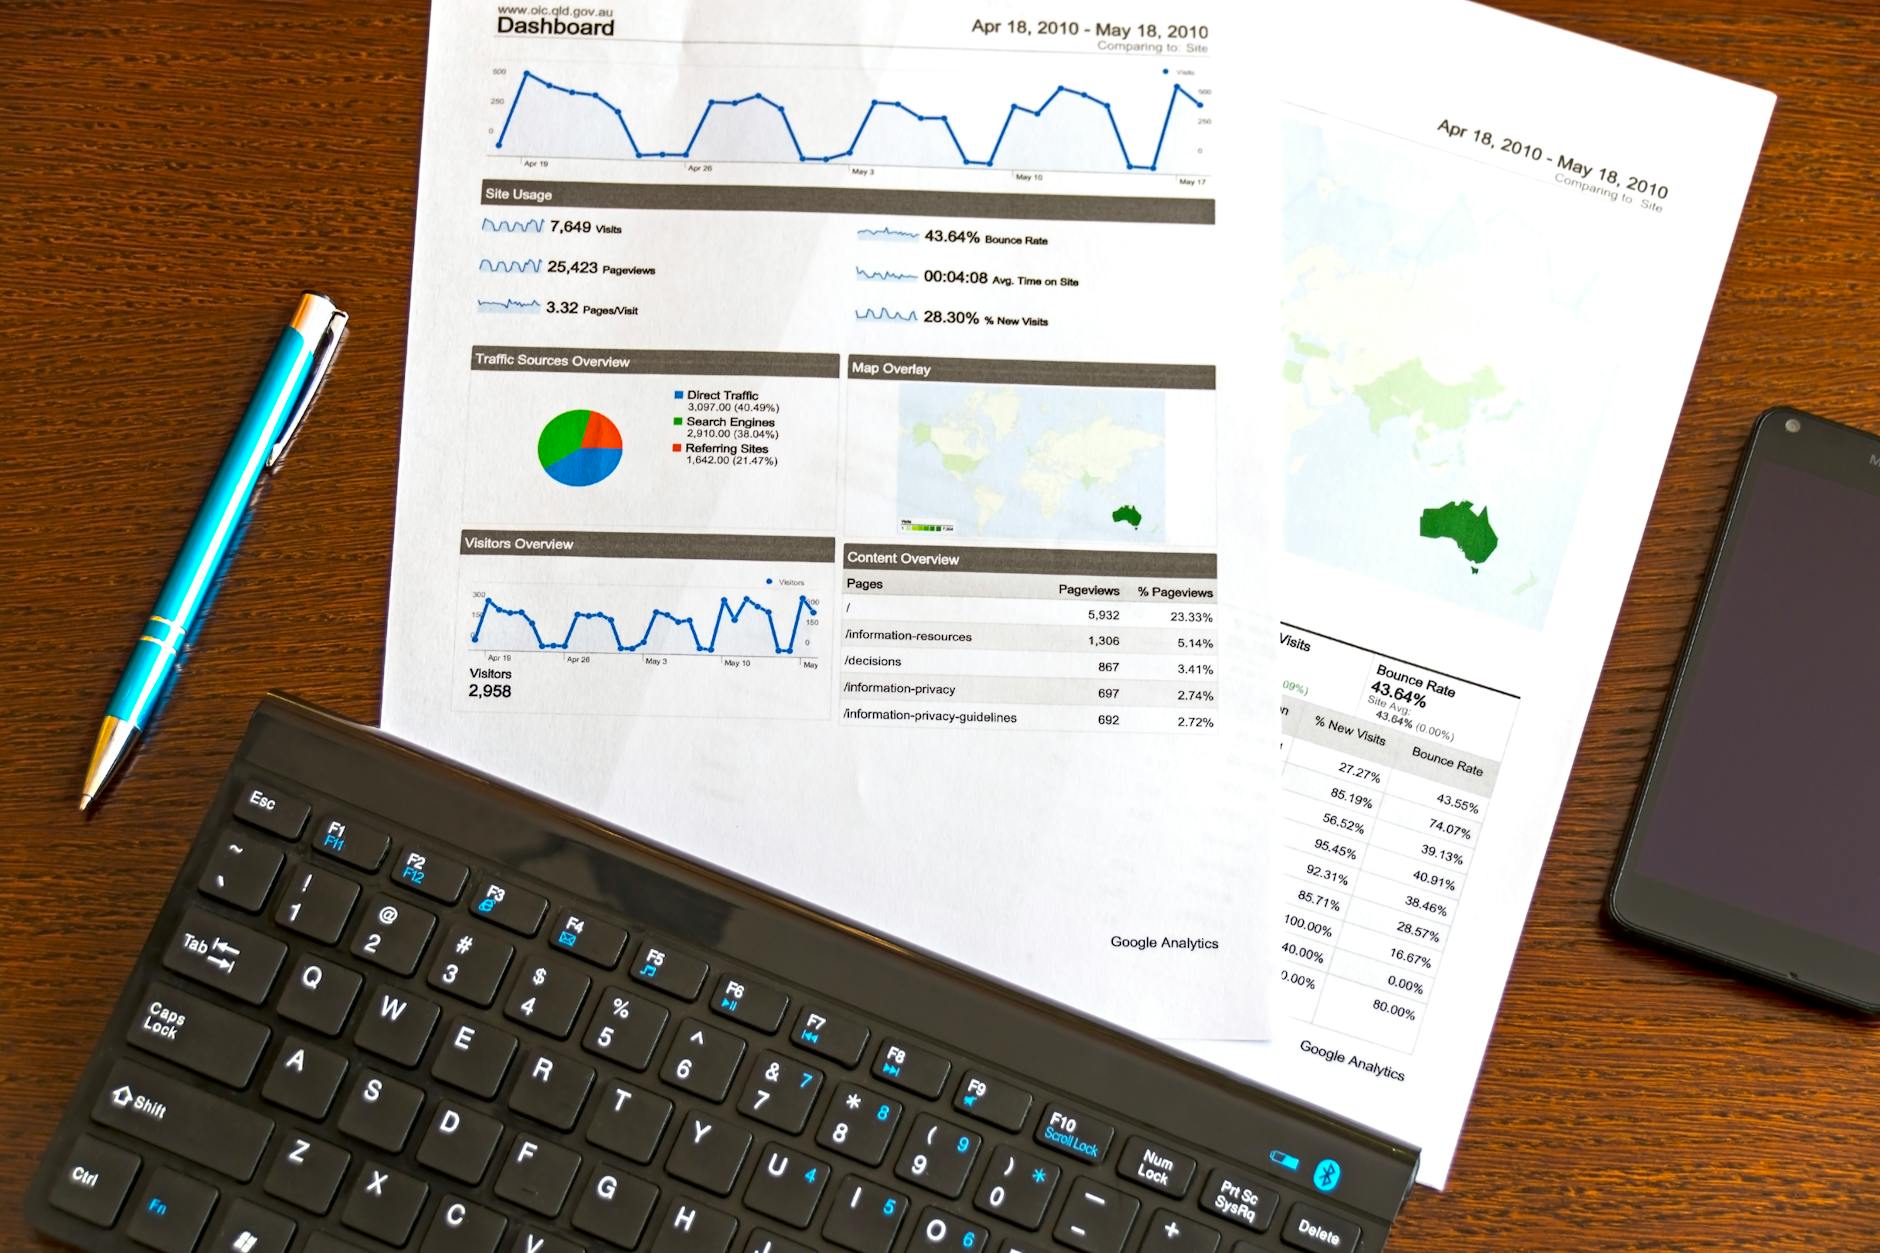
KPI dashboards serve as centralized visual tools aggregating financial data from various sources into intuitive charts, graphs, and tables. Unlike static reports, dashboards provide real-time updates, allowing finance teams to monitor ongoing performance against targets continuously. With customizable views, stakeholders at different managerial levels can access relevant insights tailored to their decision-making needs.
Additionally, KPI dashboards support drill-down capabilities, enabling teams to analyze underlying data for root causes or trends. This interactivity enhances problem-solving agility and promotes transparency across departments.
Integrating predictive analytics within finance dashboards
Modern finance teams increasingly incorporate predictive analytics into their KPI dashboards to forecast future financial outcomes and prepare for potential risks. By applying machine learning models and statistical methods, teams can project cash flow trends, budget variances, and scenario-based financial results.
For example, predictive cash flow forecasting can anticipate liquidity challenges days or weeks ahead, empowering proactive mitigation strategies such as adjusting expenses or optimizing receivables. Similarly, predictive insights help refine investment decisions and capital allocation by simulating different market conditions.
Designing effective dashboards for actionable insights
An effective KPI dashboard must balance comprehensiveness with clarity. To design dashboards that empower finance teams:
- Prioritize relevant metrics: Focus on KPIs directly linked to strategic goals rather than overwhelming users with data.
- Use clear visualizations: Employ charts such as line graphs for trend analysis, bar charts for comparisons, and gauges for performance status.
- Enable customization and alerts: Allow users to tailor views and set automated alerts for threshold breaches.
- Ensure data accuracy and timeliness: Integrate systems that provide real-time or near-real-time updates to maintain decision relevance.
The following table outlines examples of KPIs, their purpose, and typical visualization types:
| KPI | Purpose | Visualization type |
|---|---|---|
| Gross profit margin | Assess profitability at core operations | Line graph, gauge |
| Operating expense ratio | Monitor cost efficiency | Bar chart, pie chart |
| Days sales outstanding (DSO) | Evaluate accounts receivable collection period | Line graph, histogram |
| Return on equity (ROE) | Measure investment return efficiency | Gauge, bar chart |
| Cash flow forecast accuracy | Predict liquidity positions | Line graph with forecast bands |
By thoughtfully combining the right KPIs with intuitive visual design, finance teams can transform complex datasets into clear and actionable insights.
Conclusion
In conclusion, modern finance teams need to focus on essential performance metrics such as gross profit margin, operating expense ratio, and days sales outstanding to maintain comprehensive financial oversight. KPI dashboards play a vital role by centralizing these metrics, providing real-time visibility, and fostering transparency. When enhanced with predictive analytics, dashboards become powerful tools for anticipating challenges and optimizing financial strategy. Designing dashboards with clarity, customization, and precision ensures that finance professionals can quickly interpret data and make well-informed decisions. Embracing this integrated approach not only enhances operational efficiency but also equips organizations to sustain growth and competitiveness in an increasingly complex business landscape.
Image by: AS Photography
https://www.pexels.com/@asphotograpy
editor's pick
latest video
news via inbox
Nulla turp dis cursus. Integer liberos euismod pretium faucibua


