Essential Performance Metrics and KPI Dashboards for Modern Finance Teams
Essential performance metrics and KPI dashboards are transforming how modern finance teams operate. In today’s fast-paced business environment, finance professionals need to move beyond traditional reporting and adopt advanced tools and metrics that offer real-time insights into financial health, operational efficiency, and strategic outcomes. This article explores the critical performance metrics and key performance indicators that every finance team should track, alongside the role of dynamic KPI dashboards in optimizing decision-making and fostering collaboration across departments. By understanding these essential components, finance teams can not only improve accuracy and forecasting but also position themselves as strategic partners driving business growth.
Understanding key performance metrics for finance
Finance teams rely on a variety of metrics to measure success, manage risks, and align financial activities with business objectives. These metrics can be broadly categorized into liquidity, profitability, efficiency, and leverage indicators.
- Liquidity metrics: Including current ratio and quick ratio, these measure an organization’s ability to meet short-term obligations.
- Profitability metrics: Gross profit margin, net profit margin, and return on assets reveal how efficiently the company generates earnings relative to sales and assets.
- Efficiency metrics: Asset turnover and days sales outstanding (DSO) assess how well assets are used and how quickly receivables are collected.
- Leverage metrics: Debt-to-equity ratio and interest coverage ratio help evaluate the company’s financial risk and debt management capacity.
Monitoring these metrics regularly enables finance teams to identify trends, benchmark against competitors, and forecast future performance with higher confidence.
The role of KPI dashboards in modern finance management
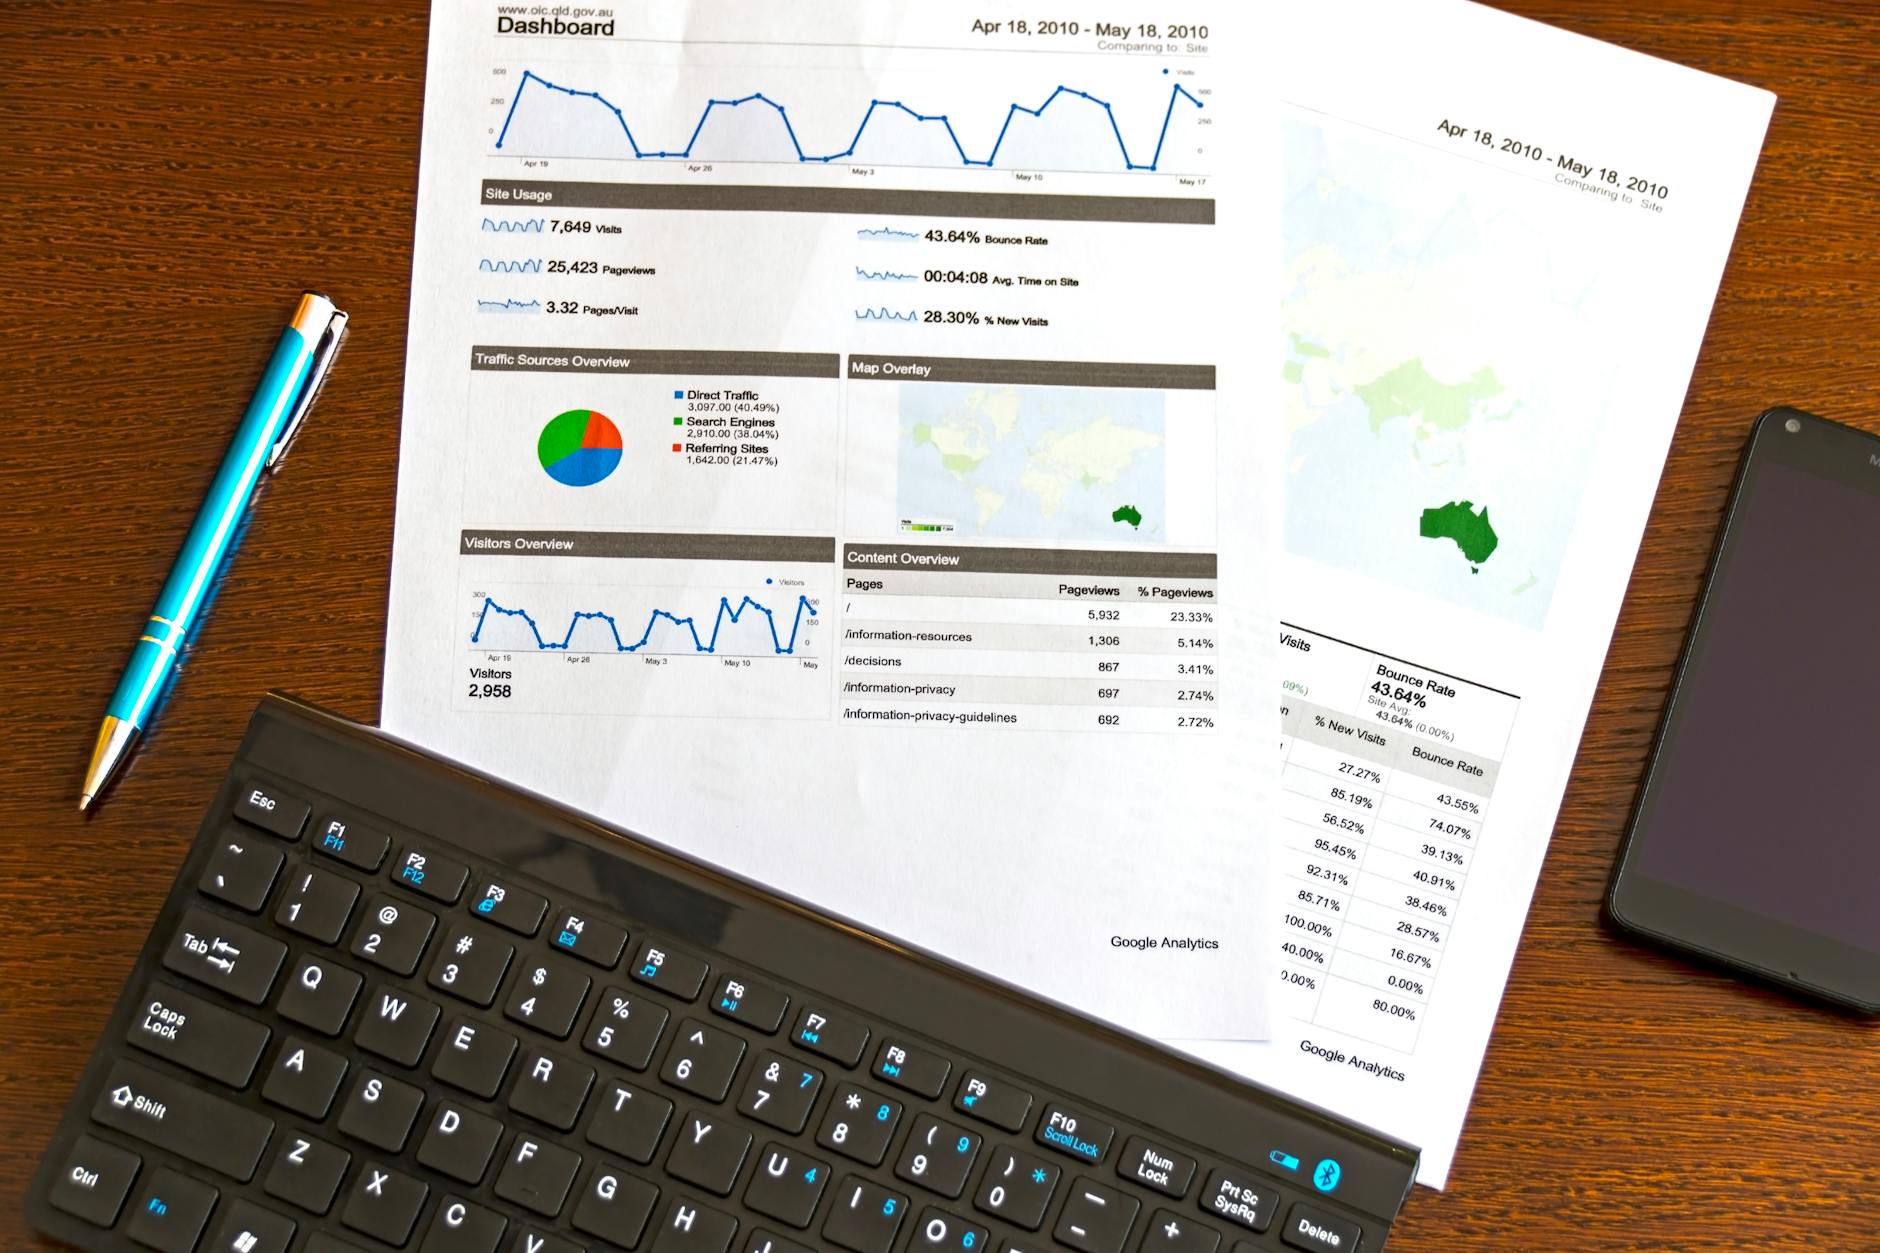
KPI dashboards are powerful visualization tools that consolidate critical financial data into one accessible interface. Modern dashboards enable finance teams to track multiple KPIs simultaneously, allowing quick identification of anomalies and opportunities without sifting through complex reports.
Compared to static spreadsheets or monthly reports, interactive KPI dashboards provide:
- Real-time updates ensuring decisions are based on current data
- Customizable views aligned with user roles and priorities
- Automated alerts for threshold breaches or unusual patterns
- Integration with multiple data sources for comprehensive insights
When finance teams leverage KPI dashboards effectively, they enhance transparency, speed up reporting cycles, and improve collaboration across finance, operations, and executive teams.
Choosing the right KPIs for your finance dashboard
Not all KPIs carry the same weight or relevance across organizations. Selecting the right KPIs requires alignment with strategic goals and operational realities. For example:
| Goal | Relevant KPIs |
|---|---|
| Enhance cash flow management | Operating cash flow, Days payable outstanding (DPO), Cash conversion cycle |
| Improve profitability | Net profit margin, Operating expense ratio, EBITDA margin |
| Optimize asset management | Asset turnover ratio, Inventory turnover, Fixed asset utilization |
| Reduce financial risk | Debt-to-equity ratio, Interest coverage ratio, Altman Z-score |
By tailoring KPIs to specific finance functions—whether it’s treasury, accounting, or financial planning—and the broader business strategy, organizations can ensure their dashboards provide meaningful guidance and actionable insights.
Best practices for implementing KPI dashboards in finance teams
Successful adoption of KPI dashboards depends not only on choosing the right metrics but also on embedding these tools within team workflows and company culture. Key considerations include:
- Data accuracy and consistency: Ensure data inputs are validated and standardized to avoid misleading results.
- User training and engagement: Provide training sessions and encourage feedback to improve dashboard usability.
- Regular review and update: Periodically reassess KPIs and dashboard design to align with changing business priorities.
- Cross-functional integration: Facilitate data sharing between finance and other departments for a holistic view.
When these practices are followed, finance teams turn KPI dashboards into a strategic tool that drives continuous improvement rather than just a reporting requirement.
Conclusion
In conclusion, essential performance metrics and well-designed KPI dashboards are indispensable assets for modern finance teams aiming to enhance their strategic impact. By focusing on key financial indicators across liquidity, profitability, efficiency, and risk, teams can build comprehensive dashboards that provide real-time, actionable insights. Selecting KPIs aligned with business goals ensures that dashboard data remains relevant and drives targeted improvements. Moreover, effective implementation hinges on data integrity, user adoption, and integration with broader organizational processes. Together, these elements empower finance teams to transcend traditional roles and become pivotal contributors to business agility and growth, navigating the complex financial landscape with confidence and precision.
Image by: AS Photography
https://www.pexels.com/@asphotograpy
editor's pick
latest video
news via inbox
Nulla turp dis cursus. Integer liberos euismod pretium faucibua


