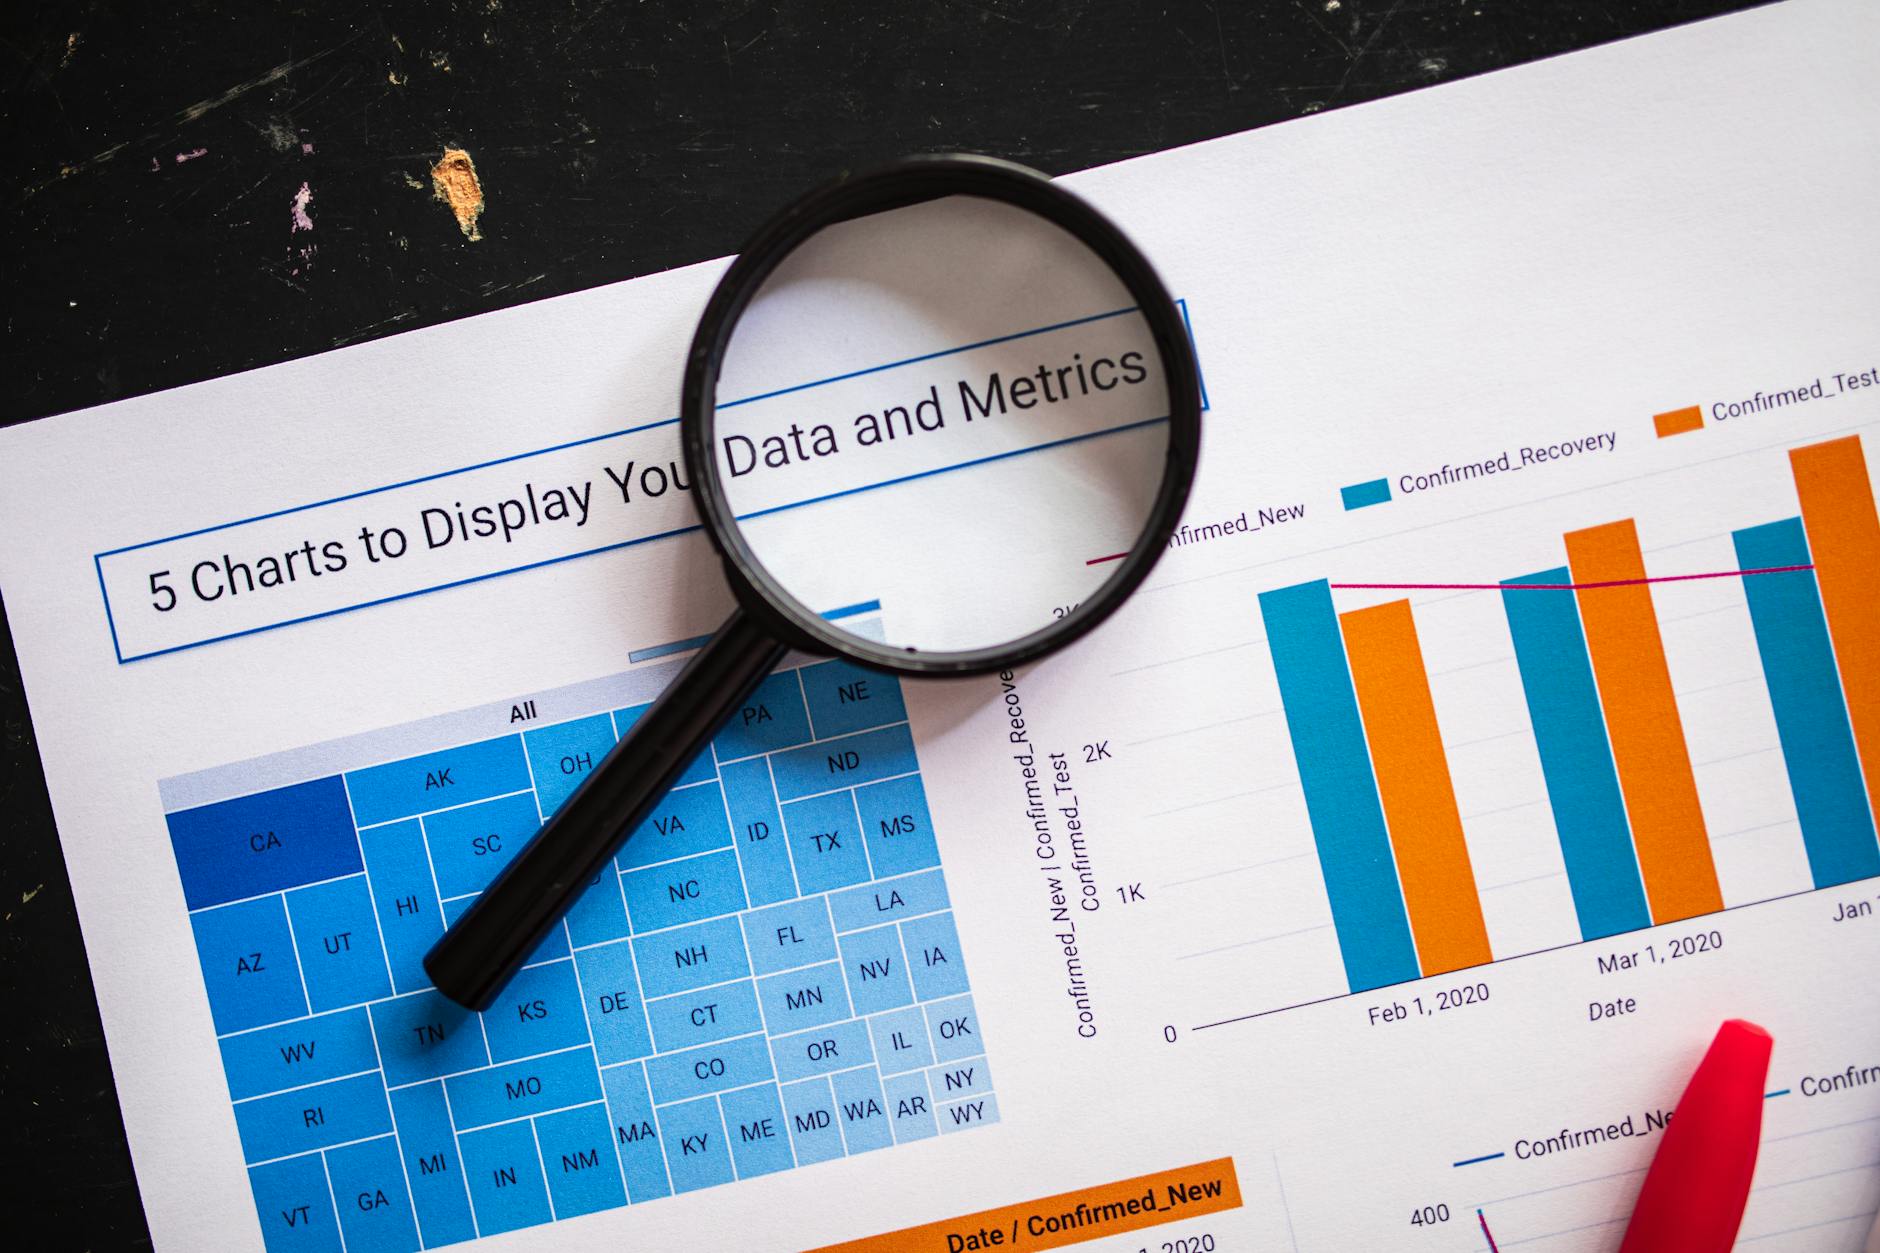
Essential Performance Metrics and KPI Dashboards for Modern Finance Teams
Essential Performance Metrics and KPI Dashboards for Modern Finance Teams
In today’s fast-paced financial environment, modern finance teams must rely on precise, real-time data to make informed decisions and drive organizational success. The ability to track essential performance metrics through dynamic KPI dashboards has transformed the way finance professionals monitor financial health, operational efficiency, and strategic outcomes. This article delves into the core performance metrics that finance teams should focus on, explores how KPI dashboards can enhance data-driven decision-making, and discusses best practices for implementing and leveraging these tools effectively. By understanding the relationship between finance KPIs and business objectives, teams can boost performance transparency, improve forecasting accuracy, and ultimately contribute more significantly to overall business growth.
Key financial performance metrics every team should track
Understanding and monitoring key financial metrics is fundamental for any finance team aiming to maintain fiscal responsibility and achieve strategic goals. These metrics provide insights into profitability, liquidity, and operational efficiency. Some of the essential metrics include:
- Gross profit margin: Indicates the percentage of revenue exceeding the cost of goods sold, showing product profitability.
- Operating cash flow: Reflects cash generated from core business operations, ensuring liquidity.
- Current ratio: Measures short-term financial stability by comparing current assets to current liabilities.
- Return on equity (ROE): Assesses the company’s ability to generate profits from shareholders’ investments.
- Days sales outstanding (DSO): Tracks the average days it takes to collect receivables, impacting cash flow.
Tracking these metrics allows teams to assess financial viability and identify areas needing attention before they escalate into problems.
Designing KPI dashboards to enhance financial visibility
A well-designed KPI dashboard consolidates critical financial data into an easily digestible format, facilitating quick insights and proactive management. To maximize effectiveness, dashboards should be:
- Customizable: Tailored to the specific needs and objectives of the finance team and stakeholders.
- Real-time: Capable of displaying live data, enabling prompt reactions to changes.
- Intuitive: User-friendly interface ensuring accessibility for users with varying technical expertise.
- Insight-driven: Emphasizing metrics that directly relate to strategic goals rather than overwhelming users with unnecessary data.
By enabling drill-down capabilities, stakeholders can explore the root causes of trends or anomalies, thus strengthening financial analysis and reporting.
Integrating performance metrics with strategic finance functions
Performance metrics become powerful when integrated with broader finance functions such as budgeting, forecasting, and risk management. For example, incorporating real-time cash flow and profitability KPIs into budgeting processes helps ensure spending aligns with revenue expectations. Similarly, linking metrics like DSO and current ratio with credit risk assessments can improve decision-making on customer credit terms.
Moreover, linking KPIs to forecast models provides early warnings of potential financial deviations, allowing teams to adjust strategies proactively. This integration results in a continuous feedback loop where performance metrics inform strategic planning, and strategic outcomes refine metric selection and targets.
Measuring success and continuous optimization of finance KPIs
Consistent review and refinement of KPIs and dashboards are vital for sustained finance team performance. This process involves:
- Evaluating relevance: Finance teams should regularly analyze whether existing KPIs still align with evolving business goals.
- Benchmarking: Comparing metrics against industry standards and peer companies to identify improvement opportunities.
- Feedback loops: Gathering input from finance professionals and stakeholders ensures dashboards meet practical needs.
- Technology adoption: Leveraging new analytics tools and automation can enhance KPI accuracy and reduce manual effort.
Below is an example table illustrating how finance teams might track KPI adjustments over a quarter:
| KPI | Q1 Target | Q1 Actual | Adjustment for Q2 | Reason for adjustment |
|---|---|---|---|---|
| Gross profit margin | 40% | 38% | Increase to 42% | Cost reduction strategies implemented |
| Days sales outstanding (DSO) | 45 days | 50 days | Reduce to 42 days | Improved collections process planned |
| Operating cash flow | $1M | $1.1M | Maintain $1M+ | Exceeded expectations; maintain focus |
Through this continuous optimization, finance teams can stay agile and responsive to both internal and external financial dynamics.
Conclusion
For modern finance teams, mastering essential performance metrics and leveraging intelligent KPI dashboards are crucial to driving effective financial management. Tracking critical metrics like gross profit margin, cash flow, and liquidity ratios offers a clear snapshot of financial health, while customizable, real-time dashboards enhance visibility and decision-making. Integrating these metrics into broader finance functions strengthens budgeting and forecasting, providing strategic insights. Moreover, continuous evaluation and adaptation of KPIs ensure ongoing alignment with organizational goals and evolving business conditions. By embracing these practices, finance teams not only improve their operational efficiency but also become key contributors to their company’s long-term success and competitiveness in the marketplace.
Image by: RDNE Stock project
https://www.pexels.com/@rdne
editor's pick
latest video
news via inbox
Nulla turp dis cursus. Integer liberos euismod pretium faucibua


