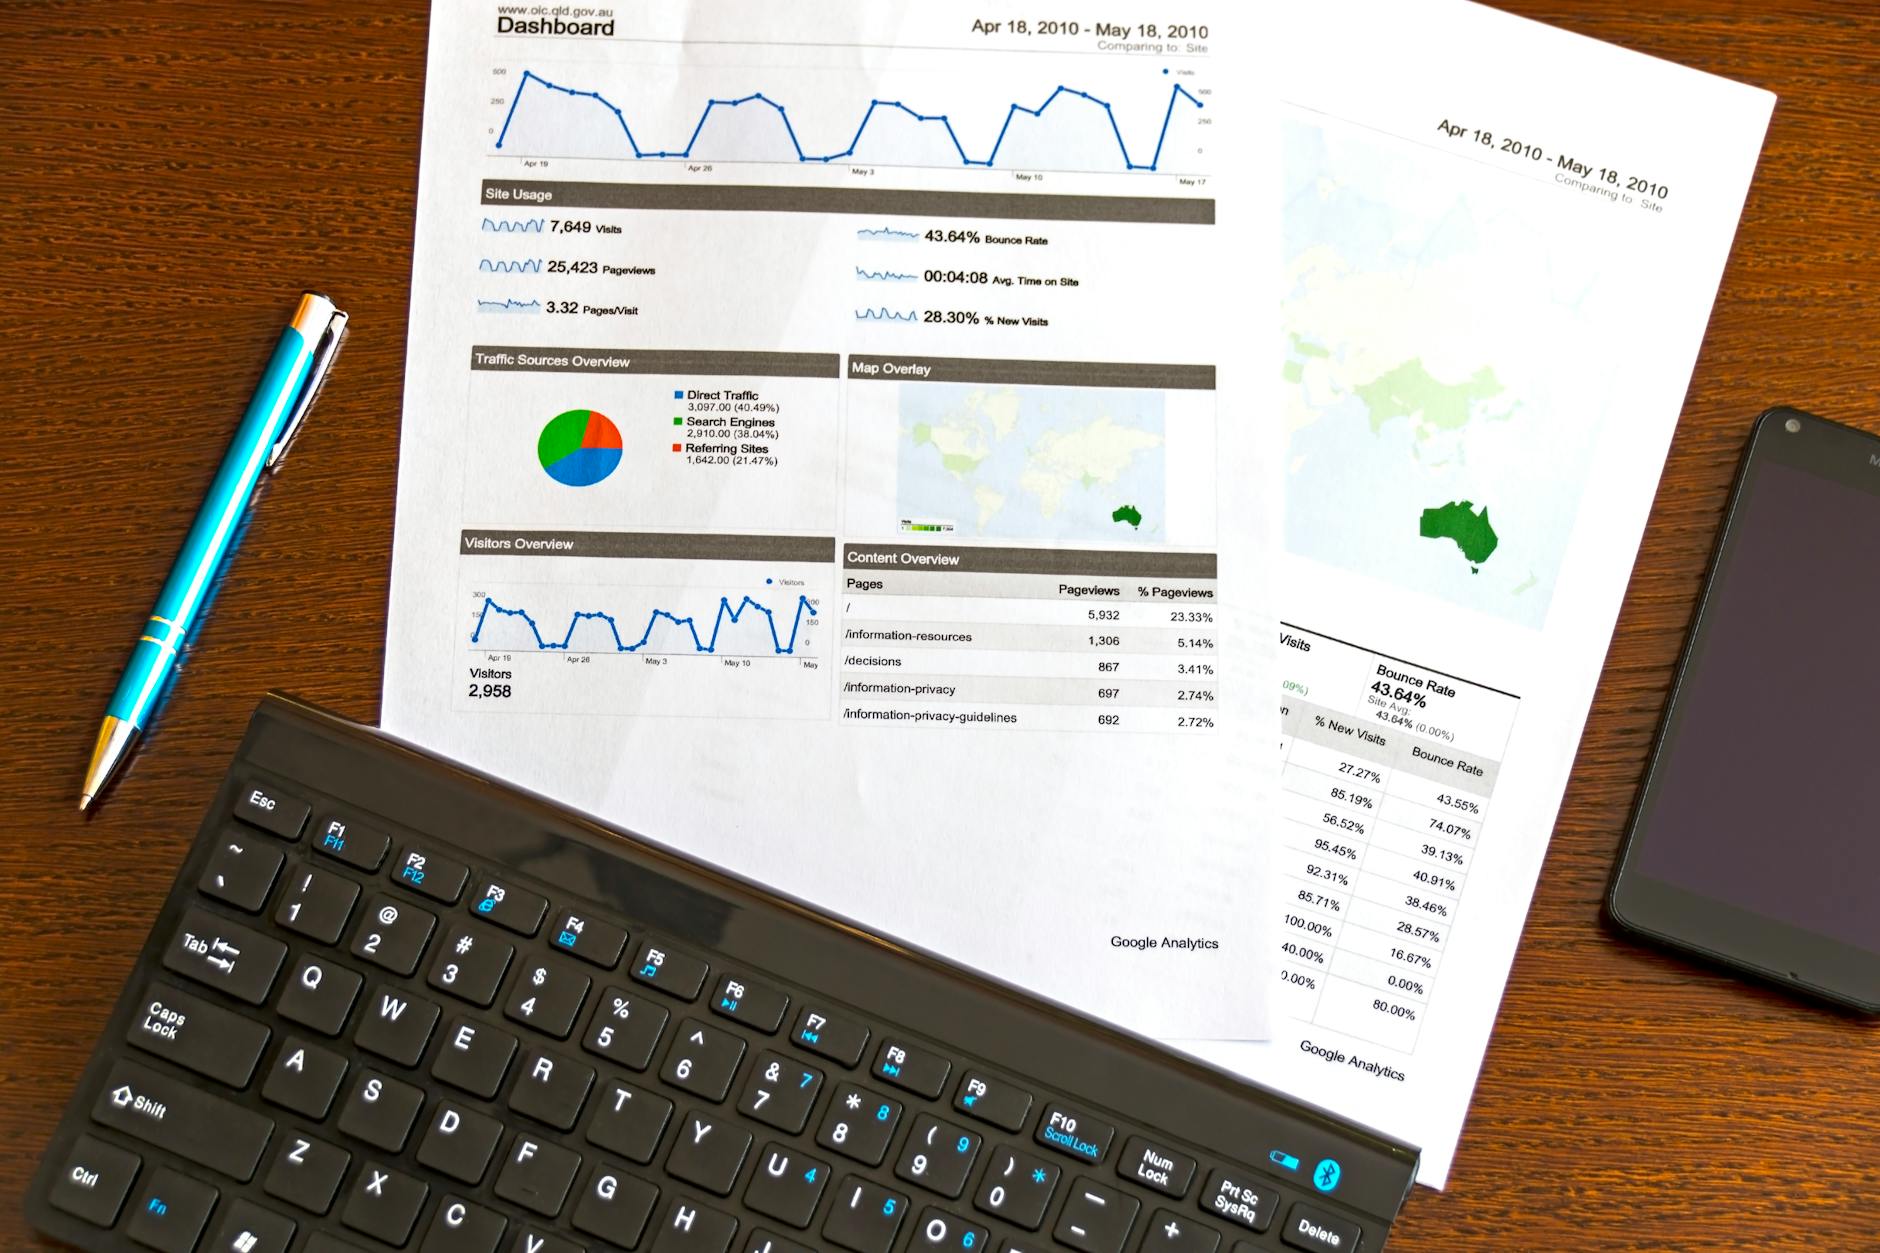
Essential Performance Metrics and KPI Dashboards for Modern Finance Teams
Essential performance metrics and KPI dashboards for modern finance teams are critical tools that drive informed decision-making and enhance operational efficiency. In today’s fast-paced financial environment, teams need to monitor a variety of key indicators that provide real-time insights into financial health, operational performance, and strategic progress. This article explores the metrics that matter most and explains how well-designed KPI dashboards can transform raw data into actionable intelligence. From cash flow analysis to revenue trends and cost control, understanding and visualizing these metrics empower finance professionals to anticipate risks, optimize resource allocation, and support long-term business goals. We will delve into the essential metrics, best practices for dashboard design, and how integration with other business systems amplifies their value.
Key financial performance metrics every team should track
Financial performance metrics serve as the backbone of any finance team’s analytical toolkit. Tracking these metrics ensures the organization’s financial stability and guides strategic decisions.
- Revenue growth rate: Measures the pace at which company revenue increases over a defined period, reflecting market demand and sales effectiveness.
- Gross profit margin: Indicates the percentage of revenue that exceeds the cost of goods sold, providing insight into pricing strategy and production efficiency.
- Operating cash flow: Monitors cash generated from operations, a crucial indicator of the company’s liquidity and ability to fund day-to-day activities.
- Return on equity (ROE): Assesses profitability relative to shareholders’ equity, helping evaluate how effectively capital is being used to generate earnings.
- Days sales outstanding (DSO): Shows the average number of days it takes to collect payment after a sale, critical for managing accounts receivable and cash flow planning.
These metrics, when consistently monitored, help finance teams spot trends, identify inefficiencies, and benchmark performance against industry standards.
The role of KPI dashboards in finance management
KPI dashboards consolidate various performance metrics into a single interactive view, allowing finance teams to analyze data quickly and comprehensively. A well-constructed dashboard enables teams to:
- Visualize complex data through charts, graphs, and tables to simplify interpretation.
- Track performance at a glance with real-time updates and alerts for anomalies.
- Align team objectives by focusing on the most relevant KPIs tied to strategic goals.
- Facilitate collaboration by sharing a unified source of truth across departments.
By integrating financial metrics into customizable dashboards, organizations ensure their leadership can make proactive decisions based on accurate, timely data rather than relying on outdated reports or spreadsheets.
Best practices for designing effective KPI dashboards
Creating dashboards that truly support finance teams requires more than just data aggregation. Several design principles should be observed:
- Prioritize KPIs that drive business impact: Avoid clutter by focusing on a limited number of high-value metrics.
- Ensure clarity and simplicity: Use intuitive visuals and avoid overcomplicated charts that may confuse users.
- Enable drill-down capabilities: Allow users to explore underlying data behind summary statistics.
- Provide context: Include benchmarks, historical trends, and targets to interpret current performance accurately.
- Optimize for accessibility and mobile use: Ensure dashboards are usable on various devices and accessible to all relevant stakeholders.
Ultimately, dashboards should empower users to take action rather than just present data. This user-centered design approach helps convert numbers into insights that fuel financial agility and growth.
Integrating KPI dashboards with broader financial systems
To maximize their effectiveness, KPI dashboards must seamlessly integrate with other financial platforms such as ERP, accounting software, and business intelligence tools. This integration offers several benefits:
- Automated data updates: Eliminates manual entry errors and ensures dashboards always reflect the latest figures.
- Holistic performance views: Combines financial data with operational, sales, and market information to provide comprehensive insights.
- Enhanced forecasting and scenario planning: Leverages real-time data for more accurate predictive analytics.
- Improved compliance and audit readiness: Maintains data integrity and traceability required by regulatory standards.
With integrated systems, finance teams can shift focus from data gathering to strategic analysis, enabling faster response to shifting market conditions and business needs.
| Metric | Description | Key benefit | Common dashboard visualization |
|---|---|---|---|
| Revenue growth rate | Percentage increase in revenue over time | Measures business expansion and sales success | Line graph showing monthly/quarterly changes |
| Gross profit margin | Profitability as a percentage of revenue | Assesses pricing and cost control efficiency | Bar chart comparing margins across periods |
| Operating cash flow | Cash generated by core operations | Indicates liquidity and operational health | Gauge or area chart showing cash flow levels |
| Return on equity (ROE) | Net income relative to shareholders’ equity | Measures capital utilization effectiveness | Scatter plot against industry benchmarks |
| Days sales outstanding (DSO) | Average days to collect payments | Helps manage cash flow and credit risk | Trend line with comparison to targets |
In conclusion, mastering essential performance metrics and leveraging KPI dashboards are indispensable for modern finance teams aiming to maintain competitiveness and drive growth. By focusing on key financial indicators like revenue growth, profit margins, and cash flow, teams gain clear visibility into the company’s fiscal health. Well-designed KPI dashboards enable quick insight delivery, promote alignment with strategic goals, and reduce the time spent on manual reporting. When integrated with broader financial systems, dashboards transform into powerful decision-support platforms that enhance forecasting accuracy and operational agility. Embracing these tools and practices empowers finance professionals to move beyond traditional number crunching toward becoming strategic business partners, ultimately fostering sustainable success in a dynamic market landscape.
Image by: AS Photography
https://www.pexels.com/@asphotograpy
editor's pick
latest video
news via inbox
Nulla turp dis cursus. Integer liberos euismod pretium faucibua


