Essential Performance Metrics and KPI Dashboards for Modern Finance Teams
Essential performance metrics and KPI dashboards for modern finance teams play a crucial role in steering organizations toward financial health and strategic growth. With the increasing complexity of financial operations and rapidly changing market conditions, finance teams need real-time insights that enable proactive decision-making. These insights come from carefully selected Key Performance Indicators (KPIs) that go beyond traditional accounting metrics to include operational and strategic goals. In this article, we will explore the most important performance metrics for finance teams, how to design effective KPI dashboards, and the benefits of using these tools. By understanding these elements, finance professionals can transform data into actionable intelligence, improve collaboration, and drive greater transparency across the business.
Key metrics every finance team should track
Modern finance teams need to go beyond basic financial statements to monitor a diverse range of metrics that give a holistic view of the company’s financial status. Here are some essential categories and examples:
- Liquidity metrics: Current ratio, quick ratio, and cash conversion cycle help assess the company’s ability to meet short-term obligations.
- Profitability metrics: Gross profit margin, operating margin, net profit margin, and return on equity (ROE) reveal overall financial efficiency and profitability levels.
- Operational efficiency metrics: Days sales outstanding (DSO), days payable outstanding (DPO), and inventory turnover gauge the efficiency of working capital management.
- Growth indicators: Revenue growth rate and Earnings Before Interest, Taxes, Depreciation, and Amortization (EBITDA) point to the company’s growth trajectory and operational performance.
Tracking these metrics helps finance teams identify areas of strength and weaknesses, paving the way for better resource allocation and forecasting.
Designing effective KPI dashboards for finance teams
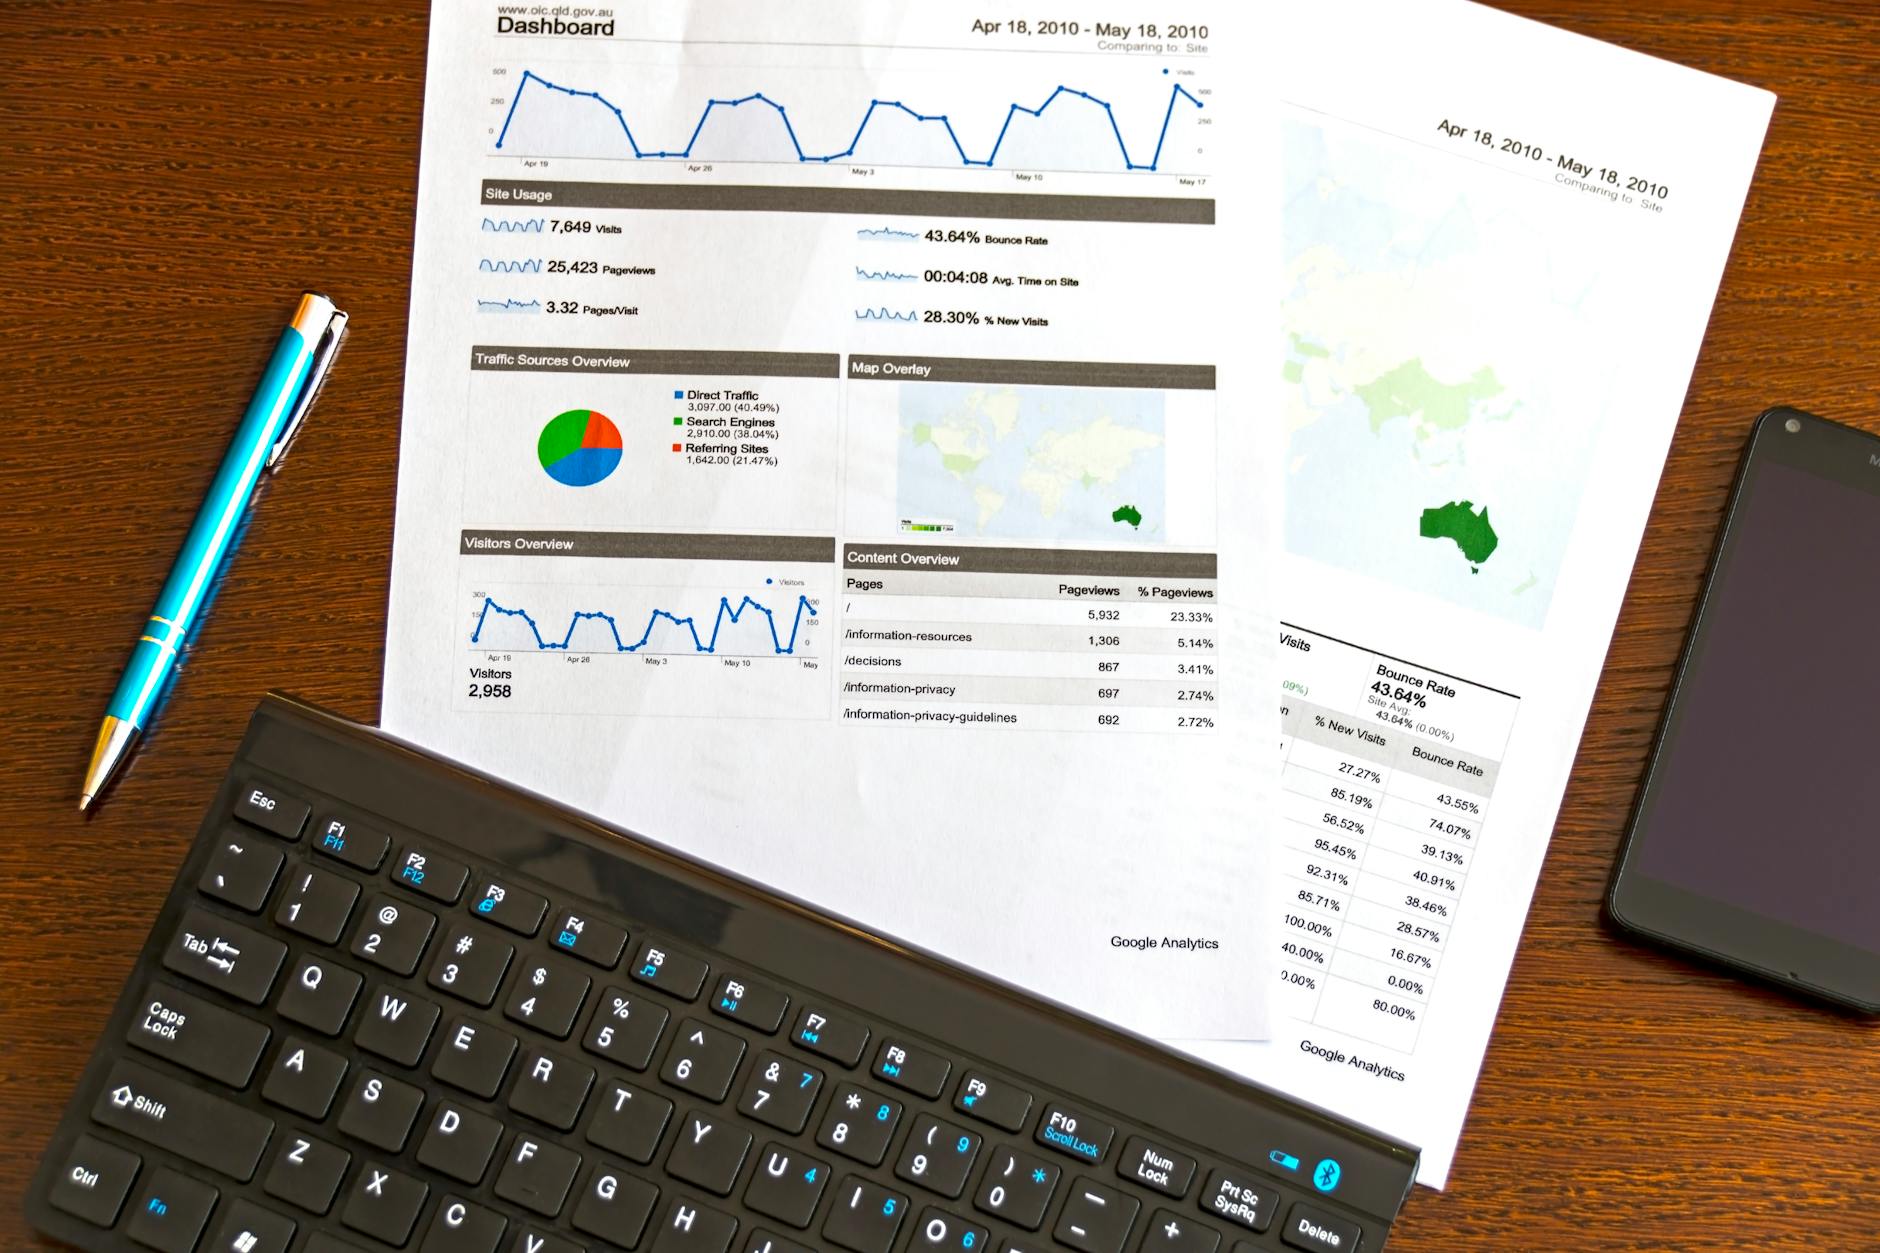
A well-designed KPI dashboard consolidates critical financial data into an intuitive visual interface that supports decision-making. Key principles include:
- Clarity and simplicity: Prioritize the most impactful KPIs and avoid clutter. Use clear labels and graphics.
- Real-time data integration: Dashboards should pull live data where possible, giving teams up-to-the-minute insights.
- Customization: Different stakeholders (e.g., CFO, controllers, analysts) need tailored views focusing on their core responsibilities.
- Drill-down capability: Users should be able to explore high-level metrics down to transaction-level details for deeper analysis.
Well-executed dashboards boost accessibility and help finance teams quickly detect trends or anomalies that require intervention.
The role of technology in optimizing finance KPIs
Advanced financial software and analytics tools enable finance teams to automate data collection, reconciliation, and reporting. These technologies allow for:
- Automated KPI calculations: Reducing manual errors and freeing up team members for strategic tasks.
- Predictive analytics: Using historical trends to forecast cash flow, expenses, and revenue more accurately.
- Collaboration features: Sharing insights and updates seamlessly within and beyond the finance department.
Investing in integrated platforms creates a technology backbone that enhances the reliability and usefulness of performance metrics.
Aligning KPIs with strategic business goals
Finance KPIs should never be measured in isolation—they need to tie directly to overall business objectives such as profitability, market expansion, or cost control. Establishing this alignment requires:
- Understanding corporate strategy and how finance supports it.
- Regularly reviewing and updating KPI sets to reflect shifting priorities.
- Communicating KPI relevance to non-financial executives and departments to encourage cross-functional collaboration.
When KPIs reflect strategic imperatives, they become powerful tools to drive enterprise-wide performance improvements and accountability.
| Metric category | Example KPIs | Strategic value |
|---|---|---|
| Liquidity | Current ratio, quick ratio, cash conversion cycle | Ensures the company can meet short-term payments |
| Profitability | Gross margin, net margin, ROE | Measures how well the company translates revenue into profit |
| Operational efficiency | DSO, DPO, inventory turnover | Optimizes working capital and cash flow |
| Growth | Revenue growth rate, EBITDA | Tracks business expansion and operational health |
Conclusion
Effective financial management increasingly depends on the ability to monitor the right performance metrics through well-constructed KPI dashboards. These tools give modern finance teams the clarity and agility to manage liquidity, profitability, operational efficiency, and growth strategically. Leveraging technology enhances accuracy and forecasting capabilities, reducing the manual workload and empowering the team to focus on value-adding activities. At the same time, aligning KPIs with broader business goals ensures finance efforts contribute directly to sustainable organizational success. In the fast-paced financial landscape, mastering essential metrics and dashboards is no longer optional but a critical enabler of robust decision-making and competitive advantage.
Image by: AS Photography
https://www.pexels.com/@asphotography
editor's pick
latest video
news via inbox
Nulla turp dis cursus. Integer liberos euismod pretium faucibua


