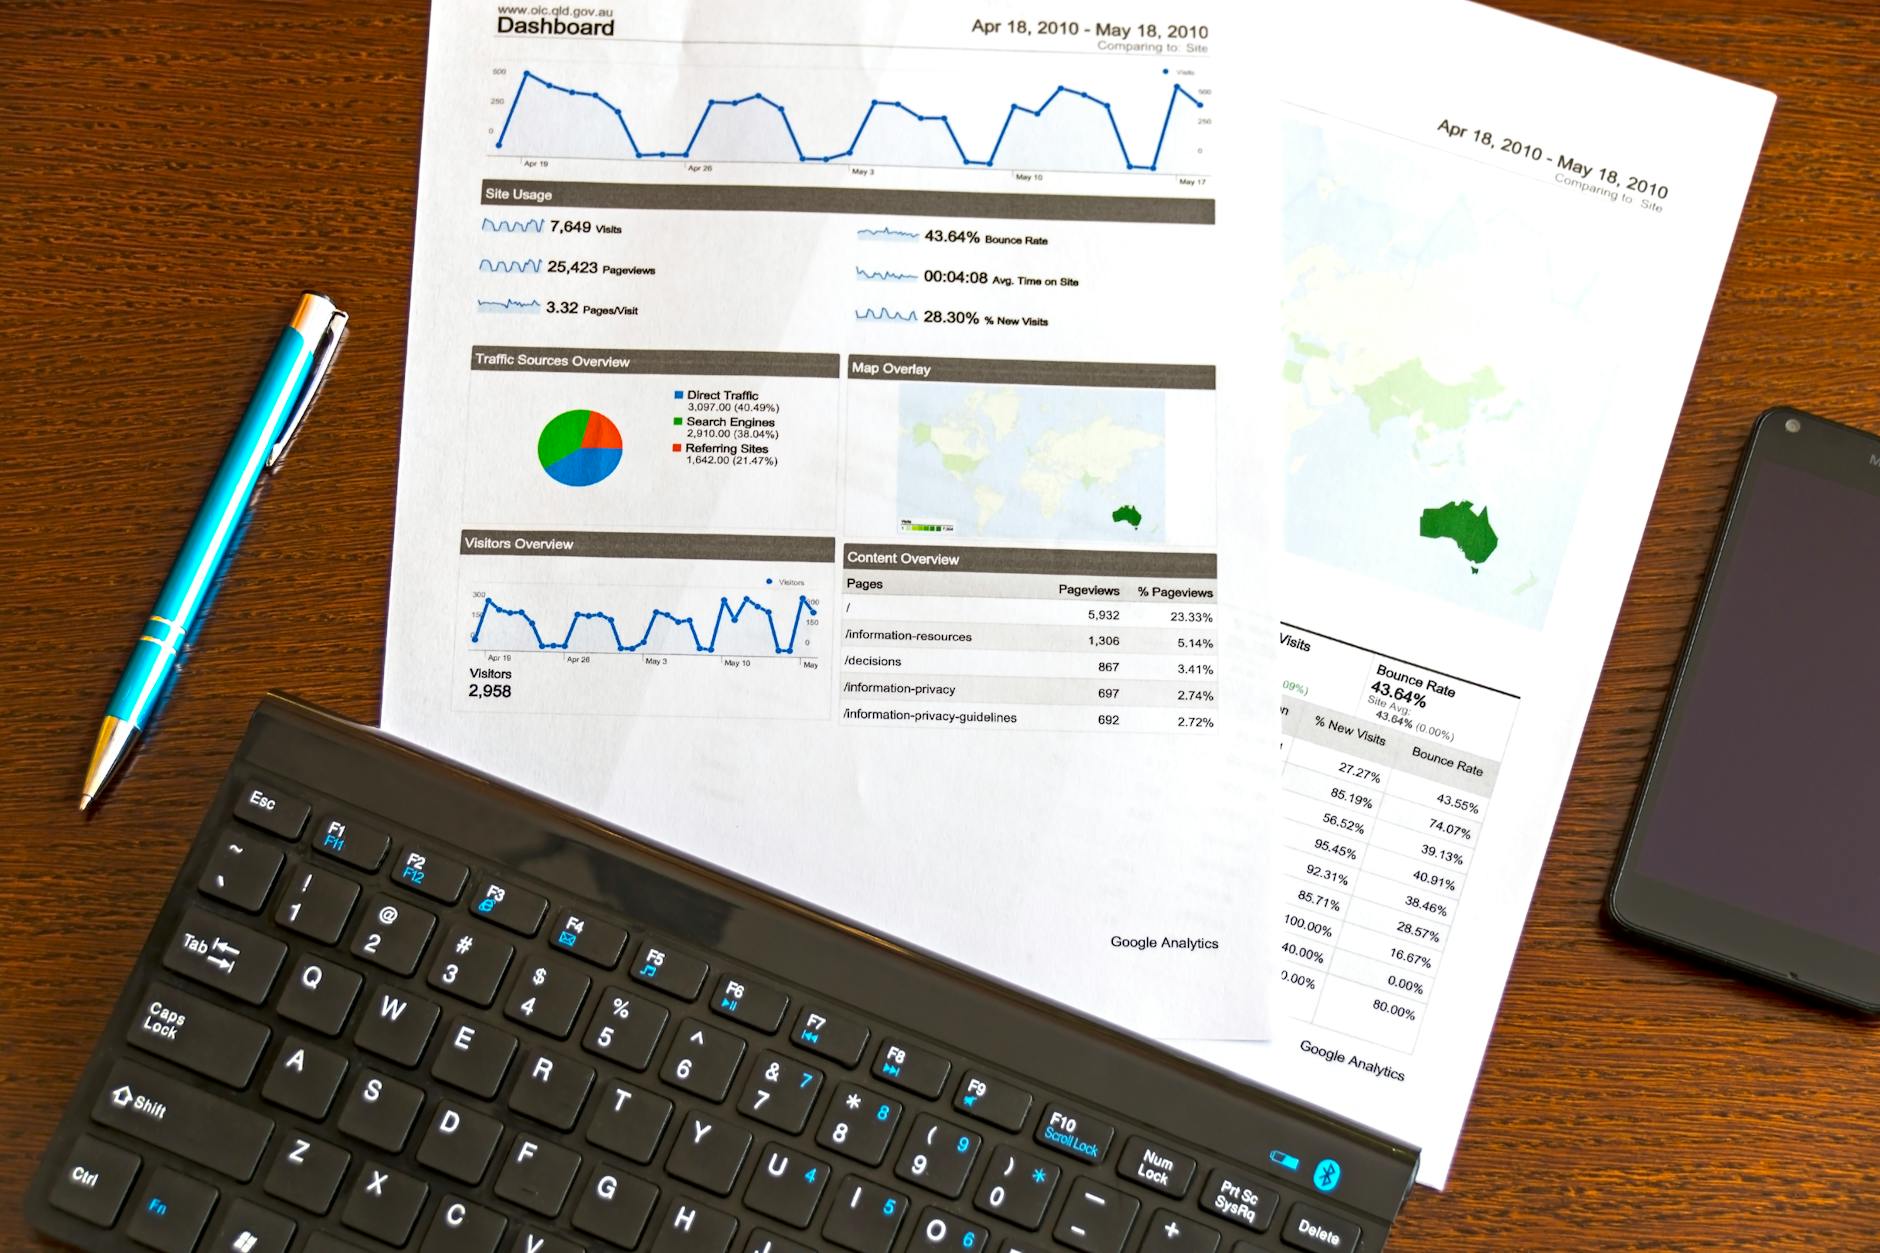
Essential Performance Metrics and KPI Dashboards for Modern Finance Teams
In today’s fast-paced business environment, modern finance teams are expected to deliver timely insights and strategic guidance beyond traditional accounting functions. To do this effectively, finance professionals rely heavily on essential performance metrics and KPI dashboards that provide a comprehensive view of organizational health. These tools enable faster decision-making, help identify trends, and keep teams aligned with corporate goals. In this article, we explore the critical performance metrics finance teams should focus on, the role of KPI dashboards in driving efficiency, and best practices for implementing these tools to maximize impact. Understanding these elements is key to transforming finance functions into proactive business partners.
Key performance metrics every finance team should track
Finance teams must monitor a range of metrics that reflect both financial health and operational efficiency. Some of the most impactful include:
- Revenue growth rate: Measures how quickly a company’s sales increase over a period, indicating market demand and business expansion.
- Operating margin: Shows the percentage of revenue left after covering operating expenses, revealing profitability at the core business level.
- Cash flow from operations: Tracks the cash a company generates from its primary business activities, crucial for sustaining ongoing operations.
- Days sales outstanding (DSO): Represents the average number of days to collect payment after a sale, impacting liquidity.
- Return on equity (ROE): Evaluates profitability relative to shareholder equity, a key indicator of financial performance.
Collectively, these metrics provide a balanced picture of revenue generation, financial stability, and operational efficiency, enabling data-driven decision-making.
The role of KPI dashboards in finance
KPI dashboards act as centralized visual tools that consolidate multiple metrics into an easily digestible format. They enhance the finance team’s ability to:
- Monitor performance in real-time: Dashboards update dynamically, allowing teams to quickly spot anomalies or trends.
- Align finance and business objectives: By linking KPIs to strategic goals, dashboards facilitate coherent planning across departments.
- Increase transparency and accountability: Clear visualization encourages stakeholders to stay informed and responsible for outcomes.
- Improve communication: Visual data presentations make complex financial insights accessible to non-financial stakeholders.
The adoption of KPI dashboards transforms raw data into actionable insights, fostering a culture of proactive financial management.
Designing effective KPI dashboards for finance teams
To maximize the benefits, KPI dashboards must be thoughtfully designed with the following principles:
- Clarity and simplicity: Focus on key metrics that align with business goals; avoid overloading with irrelevant data.
- Customization: Tailor dashboards for different users—executives, analysts, or operational managers—to meet their specific needs.
- Data accuracy and timeliness: Ensure that inputs come from reliable sources with frequent updates to maintain trust in the data.
- Interactive features: Enable drilldowns and filter options for deeper analysis without cluttering the main view.
- Consistent visual language: Use standard colors, fonts, and chart types to reduce cognitive load and speed comprehension.
Adhering to these principles promotes effective use and adoption of KPI dashboards within finance teams.
Integrating performance metrics and dashboards for strategic impact
While selecting the right metrics and designing dashboards are critical, their strategic value emerges when integrated thoughtfully into regular financial processes. This integration involves:
- Embedding KPIs in budgeting and forecasting: Aligning projections with performance indicators to refine accuracy and agility.
- Establishing cadence for dashboard review: Regular meetings wherein insights are discussed to steer business decisions promptly.
- Linking finance KPIs with broader organizational objectives: Ensuring finance supports overall business priorities and measures success accordingly.
- Driving continuous improvement: Using dashboard insights to identify process inefficiencies and areas for cost optimization.
By incorporating dashboards into strategic routines, finance teams transition from reactive roles to proactive partners that add measurable value.
| Metric | Description | Purpose |
|---|---|---|
| Revenue growth rate | Percentage increase in sales over time | Measure business expansion |
| Operating margin | Profitability after operating costs | Assess operational efficiency |
| Cash flow from operations | Cash generated by core activities | Evaluate liquidity |
| Days sales outstanding (DSO) | Average collection period | Manage working capital |
| Return on equity (ROE) | Net income relative to equity | Gauge financial performance |
Conclusion
Understanding and leveraging essential performance metrics through well-designed KPI dashboards is indispensable for modern finance teams seeking to enhance both operational effectiveness and strategic insight. By focusing on key financial indicators like revenue growth, operating margins, and cash flow, finance professionals can maintain a clear grasp of business health. Implementing intuitive and customizable dashboards fosters real-time transparency, alignment, and communication across the organization. Furthermore, integrating these tools into budgeting, forecasting, and decision-making processes empowers finance to transition from transactional support to proactive leadership roles. Ultimately, the disciplined use of performance metrics and dashboards ensures finance teams not only track results but actively drive long-term business success.
Image by: AS Photography
https://www.pexels.com/@asphotograpy
editor's pick
latest video
news via inbox
Nulla turp dis cursus. Integer liberos euismod pretium faucibua


