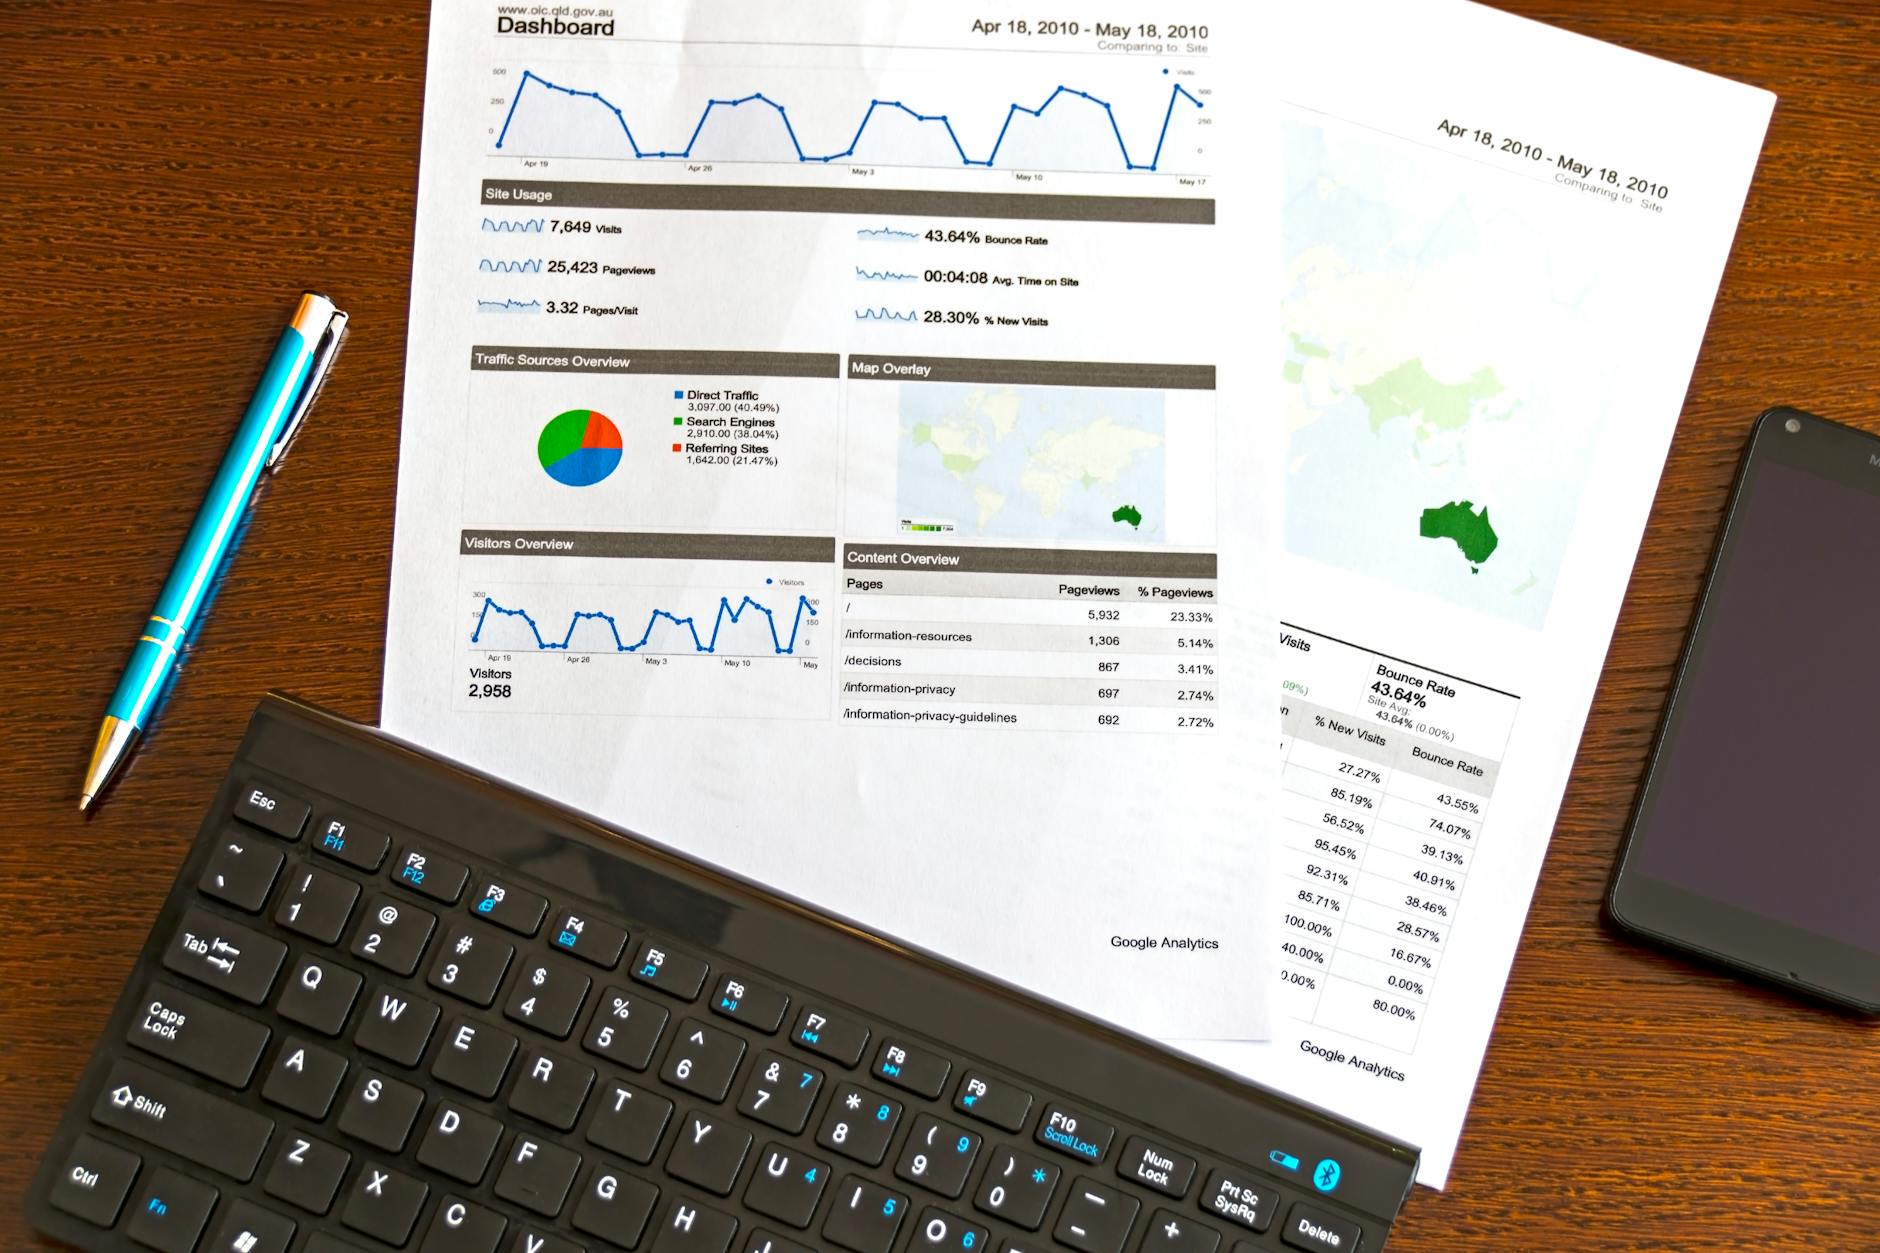
Essential Performance Metrics and KPI Dashboards for Modern Finance Teams
Essential performance metrics and KPI dashboards for modern finance teams have become vital tools in today’s data-driven business environment. As finance departments evolve from traditional record-keeping roles to strategic business partners, the ability to track, analyze, and act upon key financial and operational indicators is more important than ever. With increasing pressure to drive growth, optimize costs, and ensure compliance, finance teams rely heavily on performance metrics that provide clear insights into financial health, operational efficiency, and forecasting accuracy. This article explores the most critical metrics that finance teams should monitor and how well-designed KPI dashboards can empower decision-making, enhance collaboration, and improve overall financial management in an organization.
Identifying critical financial performance metrics
Before building effective KPI dashboards, finance teams need to identify metrics that truly reflect their goals and operational realities. Some of the most crucial financial metrics include:
- Revenue growth rate: Measures the pace at which a company’s sales income increases or decreases over a period, signaling business momentum.
- Gross profit margin: Indicates the percentage of revenue remaining after deducting the cost of goods sold, reflecting pricing strategies and production efficiency.
- Operating cash flow: Represents cash generated from core operations, providing insight into liquidity and ongoing financial health.
- Days sales outstanding (DSO): Measures the average number of days it takes to collect payments after a sale, important for cash flow management.
- Return on equity (ROE): Assesses how effectively shareholder investments generate profits, key to investor confidence.
Each metric serves as a critical lens to evaluate different aspects of financial performance, enabling finance teams to identify strength areas and potential risks.
The role of KPI dashboards in enhancing financial insights
KPI dashboards transform raw data into visual and actionable insights. For finance teams, these dashboards must integrate multiple data sources seamlessly—such as ERP systems, accounting software, and sales platforms—to provide a unified view. The key benefits of KPI dashboards include:
- Real-time monitoring of financial health and operational efficiency
- Customization to align KPIs with specific business priorities and timelines
- Trend analysis and forecasting support through historical data visualization
- Improved communication of complex data across business units via intuitive visuals
The effectiveness of a KPI dashboard relies heavily on simplicity and relevance, ensuring users can quickly interpret key metrics without overwhelm.
Aligning metrics with strategic business goals
For finance teams to add strategic value, it’s crucial that the chosen metrics support broader company objectives. This means:
- Linking financial KPIs to growth targets: For example, if the company focuses on market expansion, metrics like customer acquisition cost and sales cycle length become essential.
- Emphasizing operational efficiency: Metrics such as cost-to-income ratio and DSO help pinpoint bottlenecks and optimize working capital.
- Supporting risk management and compliance: Monitoring debt levels, liquidity ratios, and expense variances help mitigate financial risks.
Aligning performance metrics with strategic priorities ensures that finance teams are not only tracking numbers but actively driving informed decisions that propel the company forward.
Best practices for effective implementation of finance KPI dashboards
To maximize the impact of KPI dashboards, finance teams should adopt certain best practices:
| Best practice | Description | Benefit |
|---|---|---|
| Stakeholder involvement | Engage cross-functional teams and leadership early in dashboard design. | Ensures relevant KPIs and better organizational buy-in. |
| Regular review and updating | Continuously assess metrics for relevance and accuracy. | Keeps dashboards aligned with evolving business goals. |
| Automated data integration | Use automated data feeds from accounting and CRM systems. | Reduces manual error and accelerates reporting. |
| Clear visualization | Use graphs, heatmaps, and traffic light indicators for quick insights. | Improves data comprehension across all user levels. |
| Accessibility and security | Ensure dashboards are easy to access but secured as per compliance needs. | Balances user convenience with financial data protection. |
By following these practical guidelines, finance teams can develop dashboards that not only inform but actively contribute to smarter business decisions.
Conclusion
Modern finance teams operate in an environment that demands agility, accuracy, and strategic insight. Essential performance metrics such as revenue growth, profit margins, cash flow, and DSO provide a comprehensive picture of both financial status and operational efficiency. KPI dashboards serve as the vital interface that transforms data into usable intelligence, enabling real-time decision-making and cross-team collaboration. When carefully aligned with business objectives and implemented following best practices, these dashboards enhance transparency, drive accountability, and empower finance teams to move beyond traditional financial reporting. Ultimately, adopting the right metrics and dashboards transforms finance from a support function into a core strategic partner, driving sustained organizational success.
Image by: AS Photography
https://www.pexels.com/@asphotograpy
editor's pick
latest video
news via inbox
Nulla turp dis cursus. Integer liberos euismod pretium faucibua


